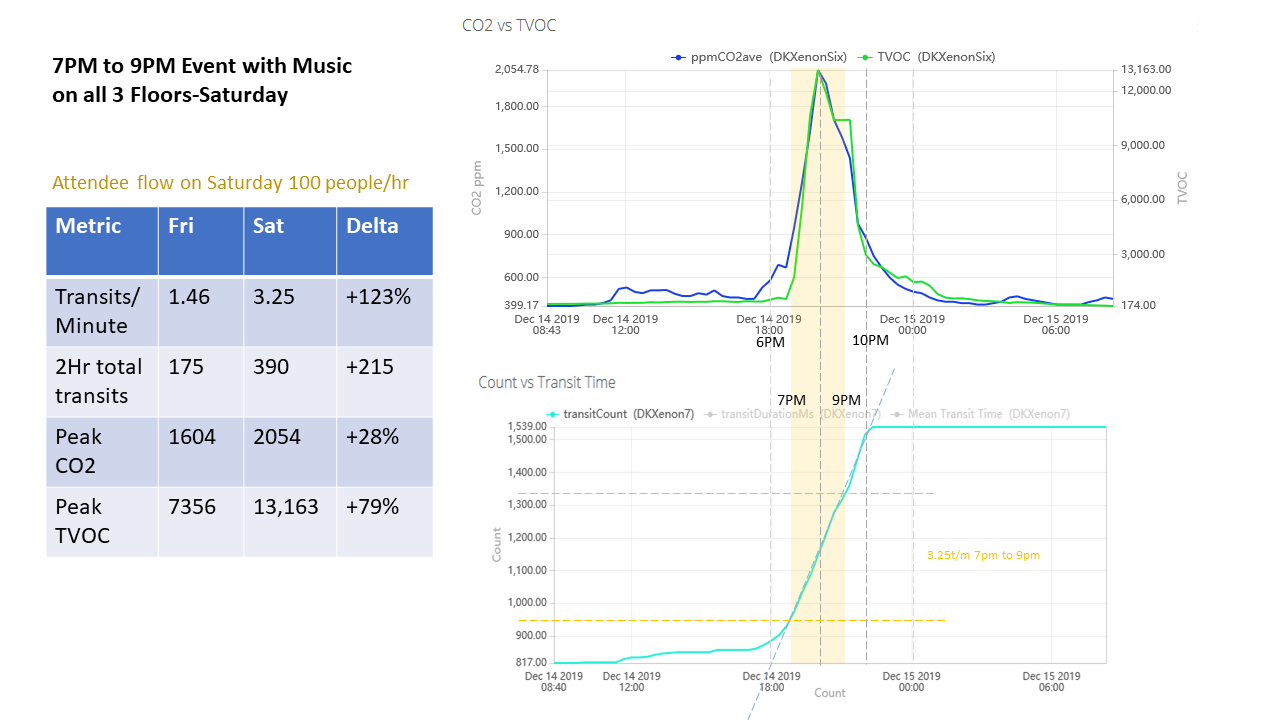
Example of a Trellis or Lattice plot showing a comparison of event attendee flow and corresponding increase in CO2 and TVOC levels. The TVOC in green response is very strong due to the presence of ethanol alcohol from alcoholic beverages.

Data Driven Insights for Better Decisions
Data Driven Insights for Better Decisions