
Charts can be used to compare values, composition, distribution, trends, relationships, and more.
A simple dashboard example:
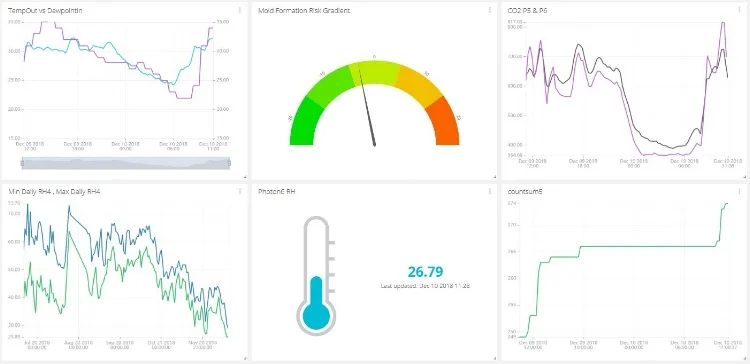
The size and number of graphical widgets can be drag-and-drop adjusted as desired. Many types including bar charts, histograms, scatter plots, rose chart, and more are available in the dashboard.
