
Indoor Air Quality (IAQ)
Key IAQ metrics include carbon dioxide, volatile organic compounds, and particulate matter.

In this example, we see a sharp rise in CO2 and TVOC closely correlated with visitors at a scheduled event.
TVOC = Total Volatile Organic Compounds
Example CO2 standards: EPA 5000ppm, EU 3500ppm, ASHRAE 1200ppm
LUX & UV:
Perhaps the first institutional illumination standard: the 75 microwatt per lumen standard was derived from the work of G. Thompson, The Museum Environment (London: Butterworths, 1986). The 75 microwatt per lumen standard is based on the output from a standard incandescent lamp.
Information on lumens vs lux located here.
Example LUX/UV recommendations from the Western Australian Museum:
For very sensitive objects a limit of 50 LUX and 1500uw/m2
For sensitive objects a limit of 200LUX and 15,000 uw/m2
Conversion between relative and absolute UV values described here.
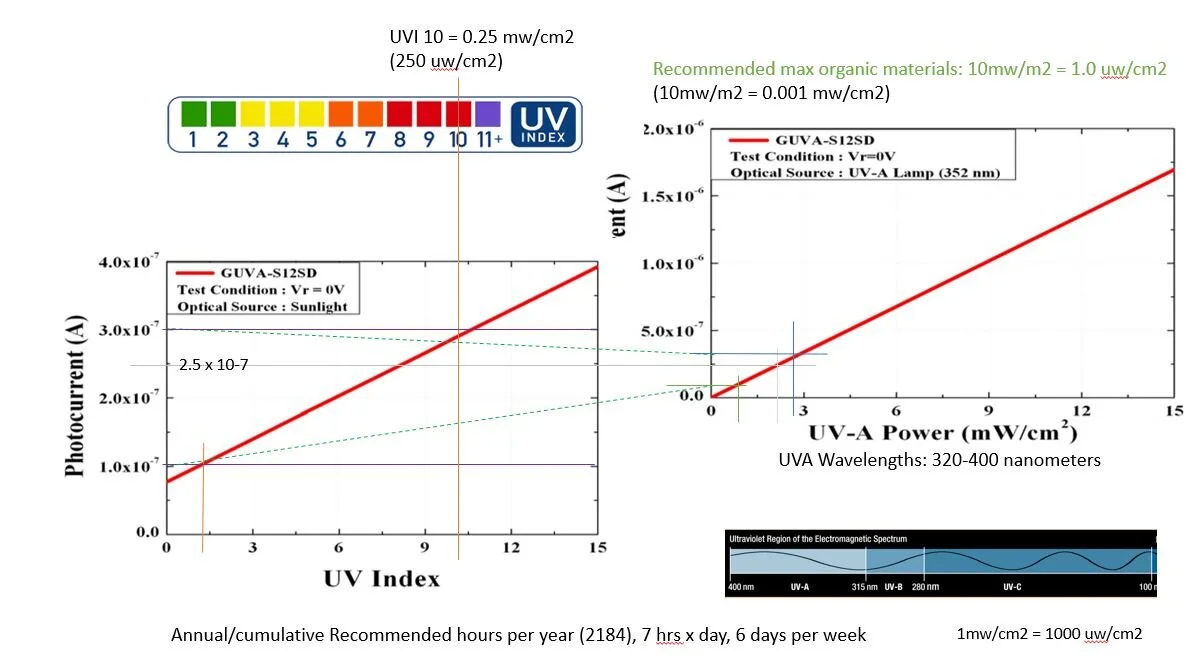
UV Index: is a calculated, weighted measure of exposure risk to human skin and eyes. A UV index of ten indicates an irradiance level (light intensity at the surface) of 0.25 milliwatts per centimeter squared.
Very useful unit conversion table located here.
Risk of Mold Formation: Mold can grow on virtually any organic material as long as moisture and oxygen are present.
The dew point is the temperature the air needs to be cooled to achieve a relative humidity of 100%. At this point the air cannot hold more water gas form, and water vapor will precipitate out in liquid form at lower air or surface temperatures (at constant pressure). This can be a concern if indoor air is rapidly cooled by an HVAC system without removing moisture from the air at a sufficient rate.
The higher the dew point, the greater amount of moisture in the air. The "temperature safety margin" decreases to only10 degrees at an RH of 70% (More Detail Dew point chart). e.g., increased risk as temperature falls outside during the night, especially on interior surface of outside walls, windows, etc.
Composite Indicator Example:
Integrating outside temperature data from the National Weather Service and creating a new composite metric by subtracting this external temperature from the interior dew point.

Composite Metric: Integrated NWS API microservice provides local T_outside via dashboard variable.
To increase the resolution of condensation risk, a non-contact IR temperature sensor can be added to measure and collect the surface temperature of the inside surface of exterior walls or other surfaces.
Visitor Experience:
Visitor experience metrics include CO2, TVOC, particulate matter, temperature, humidity, dew point, and heat index.
There is a wide range for individual comfort during the summer months and dependent on activity level. A general dew point comfort outline:
Less than 55: dry and comfortable
Between 55 and 65: becoming increasingly uncomfortable
Greater than 65: lots of moisture in the air, becoming oppressive
In the winter, a higher level of humidity can be tolerated because getting rid of body heat is less often a factor.
Visitor Experience: This live data example shows interior relative humidity over a 18 month cycle, AND THE LINK NEEDS TO BE UPDATED!
Live data from your dashboard like the graph above can be embedded in your institutional website.